Signal Extraction: From 3D Spectrograms to 1D Time Series
With the signal correction pipeline delivering clean, calibrated data, it’s time to tackle the next challenge: extracting meaningful spectral signals from the AIRS-CH0 frames. The goal is to transform bulky 3D arrays into a focused 1D time series that capture the wavelength signals over time for each star.
Checkout the AIRS-CH0 signal extraction notebook on GitHub
1. The challenge
After signal correction, each planet’s AIRS-CH0 data consists of thousands of frames, each containing a 32×282 pixel spectrogram. But here’s the key insight: not all detector pixels contain useful signal. The spectral data is concentrated in just a few rows where the dispersed starlight creates a distinct spectral trace.
The question becomes: how do we automatically identify and extract just the signal-bearing rows from each frame?
2. Intelligent signal extraction
The solution involves analyzing the signal strength across detector rows to identify the “spectral strip” - the handful of rows containing the actual dispersed spectrum:
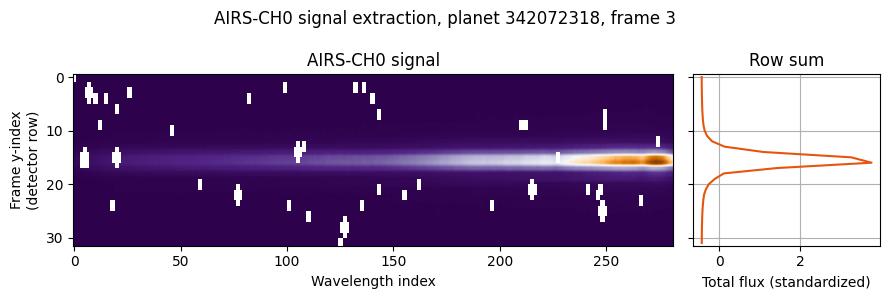
The plot reveals the signal structure clearly: rows 14-17 contain the strongest signals. Outside of that narrow spatial band, the signal drops off quickly. This makes sense - the telescope’s grism disperses starlight into a narrow horizontal band across the detector.
Rather than hardcoding row numbers (which might vary between planets), the extraction algorithm uses an adaptive threshold approach:
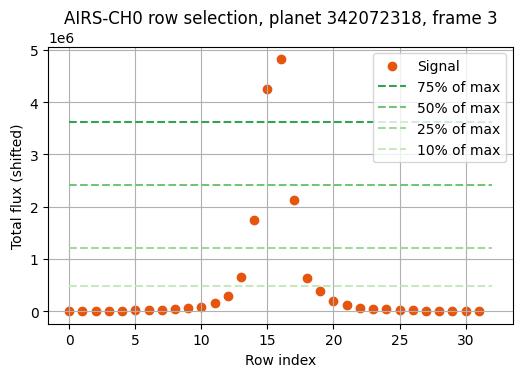
- Analyze signal strength: Sum pixel values across each row in the first frame
- Apply inclusion threshold: Select rows with signal above a configurable threshold (typically 75-95% of peak signal)
- Extract and sum: Pull out the selected rows from all frames and sum them within each frame to create a 1D spectrum for each time point
- Optional smoothing: Apply moving average filtering to each wavelength index across the frames to reduce noise
3. Extracted data
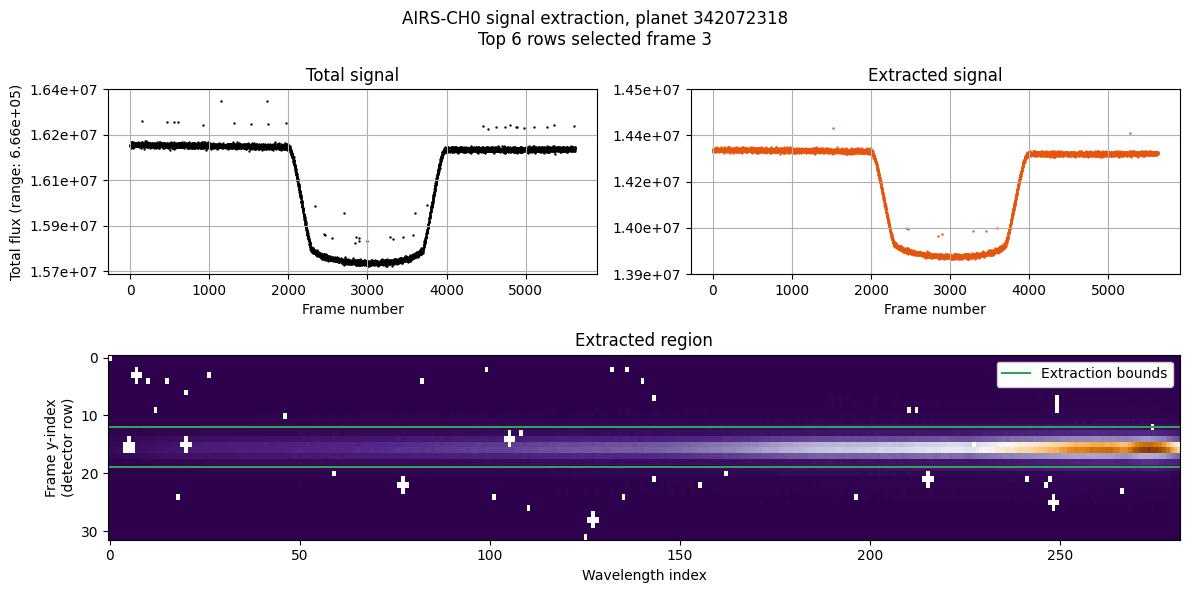
The results are impressive: the extracted signal strip shows exoplanet transits just as clearly as using the total frame flux, but with dramatically reduced data volume and a subjective reduction in outliers. Summing the brightest rows also reduces noise in the spectrum derived from each frame.
4. Performance impact
The signal extraction provides substantial benefits:
- Data reduction: From 9024 pixels per frame down to just 282 wavelength values (97% reduction)
- Noise reduction: Focusing on high-signal rows improves signal-to-noise ratio
- Processing speed: Smaller datasets mean faster downstream analysis