AIRS-CH0 & FGS1 signal EDA
Next up - let’s take a look at the signal data from both instruments: FGS1 (the guidance/alignment camera) and AIRS-CH0 (the IR spectrometer).
- AIRS-CH0 notebook on GitHub.
- FGS1 notebook on GitHub.
1. AIRS-CH0 sample frames
Here are some example frames from AIRS-CH0 for a random planet:
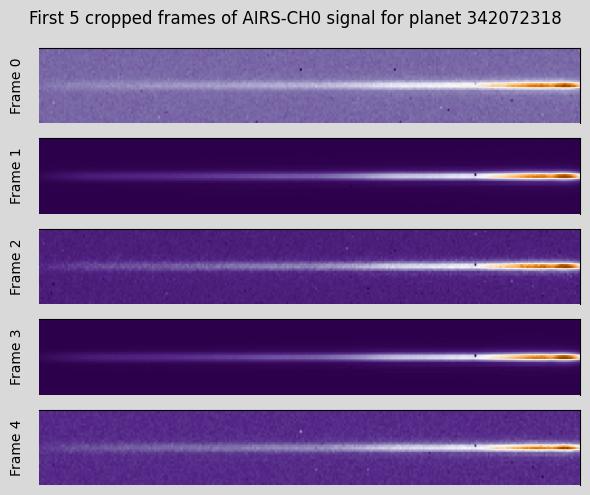
I think I’m starting to get it. Those smears are spectra (duh) - Ariel must put the signal through a grism or prism or something. Nice hint from the competition organizers about cropping the frames with [:, :, 39:321]. Now we have a 1 to 1 correspondence between the pixels across the observed spectra and the wavelengths (though let’s not assume no overlap). One more hint the organizers dropped in the preprocessing notebook: ‘Data reduction is crucial in astronomical observations’. We should be able to do much better than just cropping off the right hand part of each frame. I bet we can isolate just the ‘strip’ that contains the actual data. I also now understand why they included the guidance camera frames - it will probably make it much easier to spot exoplanet transits than trying to use these IR spectra smears.
2. FGS1 sample frames
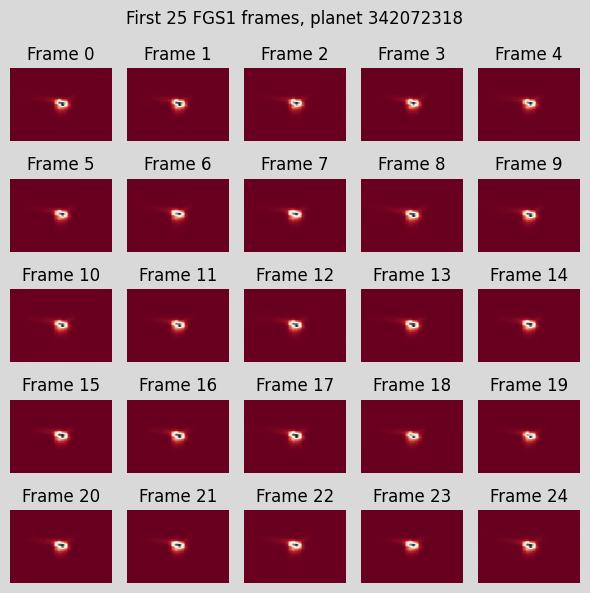
Yep - just what I thought. These are images, not spectrograms. The FGS1 frames are much smaller and could be cropped even smaller. We can use the total brightness to see the transits. In fact, I bet they jump right out…
3. FGS1 total signal over time
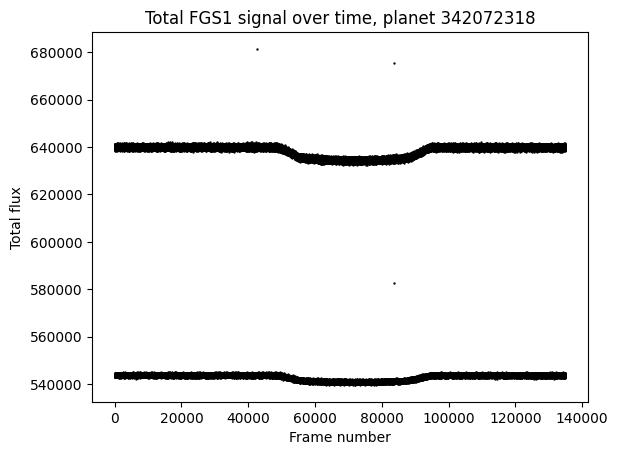
Bingo - definitely need some calibration, etc., but the transit is obvious, even though we are looking at ~1.5% reduction in signal during the transit. We can probably dump a lot of data here too. I think the two traces are probably the alternating detector read sampling strategy (correlated double sampling - CDS) mentioned in the data page on the competition data page. We could probably just take the high signal trace. That by itself will cut the data in half. Then, since we are only interested in the spectrum of the planet we can take pieces of the time series. Maybe just the bottom of the well and one of the limbs. Use those parts of the time series for signal and background.
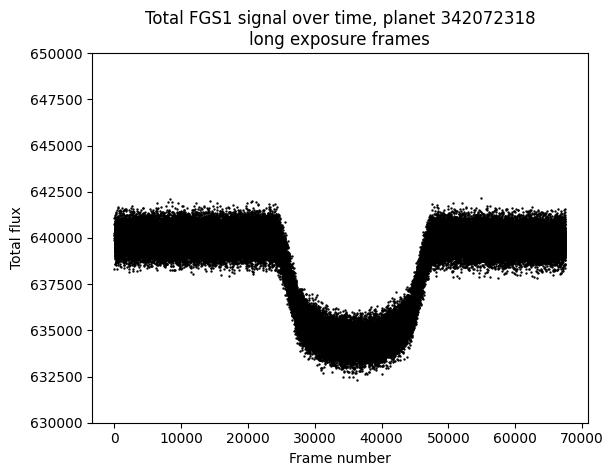
Wow, this is a cool problem. One last thing before we call it a night - can we see the transit visually?
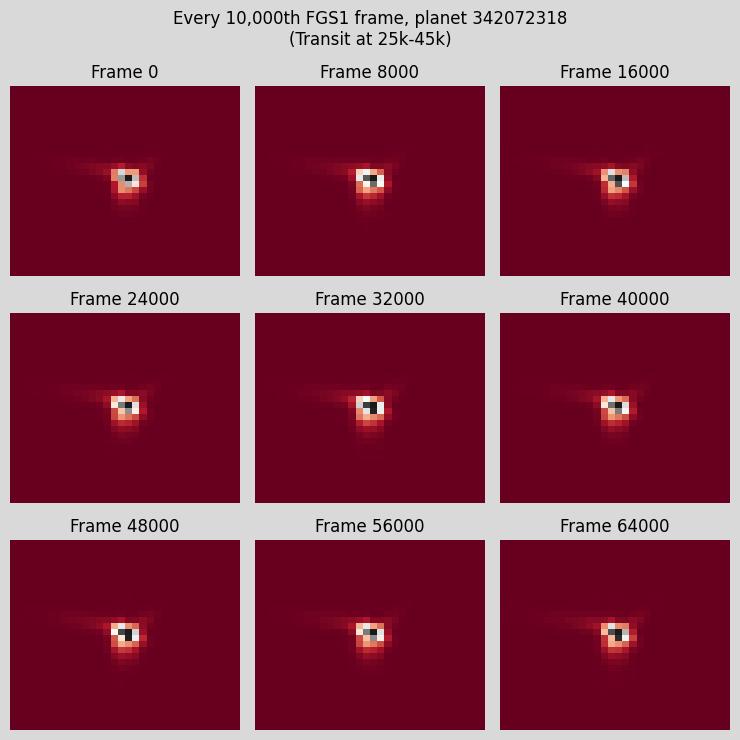
Nope, I can’t convince myself that I see a transit in the images. But the total flux plot is pretty unambiguous. Still not sure how exactly to get the uncertainties - some kind of bootstrapping probably.
Here’s the tentative plan:
- Figure out how to to efficiently spot transits in the FGS1 data.
- Use transit info from FGS data to isolate transit spectral data from AIRS-CH0.
- Use some kind of bootstrapping or ensemble method to learn the spectrum and get uncertainties.
I think the next thing to focus on is figuring out how to/if we can align the FGS1 and AIRS-CH0 signals in time. The time series have different numbers of frames, but I think there is probably going to be some metadata we can use in the ancillary data files. Tomorrow.