Project Introduction & Initial EDA
Welcome to my exploration of the Ariel Data Challenge 2025! This Kaggle competition presents a fascinating problem: extracting planetary atmospheric spectra from simulated space telescope observations.
Checkout the spectra EDA notebook on GitHub.
1. The Challenge
The Ariel space mission, scheduled to launch in 2029, will study the atmospheres of approximately 1000 exoplanets through transit spectroscopy. This competition gives us a taste of what that data analysis will look like, complete with realistic instrumental noise, calibration challenges, and systematic effects.
2. Initial Data Exploration
2.1. Aggregate spectrum
I’ve started with an exploratory data analysis of the ground truth spectra to understand the dataset structure and characteristics. First up, how is the signal distributed across different wavelengths?
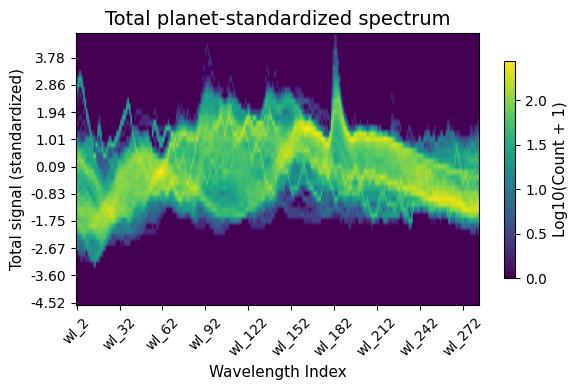
This heatmap shows the distribution of planet-standardized signal values across wavelengths. Each planet’s spectrum has been standardized using its own mean and standard deviation, revealing the underlying spectral patterns independent of individual planet brightness levels. The x-axis shows wavelength indices, while the y-axis represents standardized total signal values (Z-scores).
2.2. Total signal per star
Second, let’s take a look at the relative brightness of the stars in the dataset:
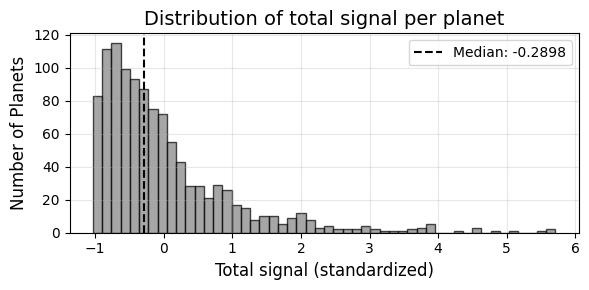
Tailed high - interesting. The biologist in me expects this to be normally distributed as a ‘natural’ population, like peoples’ heights. I bet there is an artificial cut-off at play - they don’t point the cameras at stars which are too dim.
2.3. Spectral fingerprints
Last, let’s look at each starts aggregate spectrum:

This visualization shows all 1100 planets ordered by hierarchical clustering based on their standardized spectral signatures. Each row represents a planet, and each column represents a wavelength. The planets have been grouped by spectral similarity using Ward linkage clustering, revealing distinct groups with similar spectral characteristics.
Next Steps
The initial EDA has revealed interesting spectral features and distribution patterns; as you can see from the figures, there is a lot going on! Moving forward, I’ll be diving into:
- Analysis of the raw detector images from both FGS1 (guidance camera) and AIRS-CH0 (science instrument)
- Transit detection algorithms
- Spectral extraction techniques
- Machine learning approaches for robust spectrum recovery
Stay tuned for more updates as I work through this fascinating intersection of astrophysics and data science!